Perhaps it will never be used and / or no one really needs to know this technical minutiae, but I’m documenting as much as possible the work that will lead up to this Creative Commons Certificate.
Yesterday I wrote up a bit of this duct taped system to collect via a Google Form resources as suggestions for the materials we will develop / provide, to organize in a Google spreadsheet, and then use some web code to create a browse / search / filter interface.
Elsewhere I was trying out one of Martin Hawksey’s new tricks for his Twitter TAGS system that uses some tools to geolocate data in a spreadsheet and render it via a map using the Awesome Table Geocode add-on.
In an email exchange where I had asked Martin a question, he suggested in response to my post on flipping tables that I look at the general Awesome Table tools as an alternative approach.
It did not take too long to make a new sheet with the data I was using into the form Awesome Table needs (it needs on more row below the column titles to indicate the kind of filters and parameters to use.
This is now in place on my test page for viewing the resources in the spreadsheet, and it’s already more awesome than what I had before.
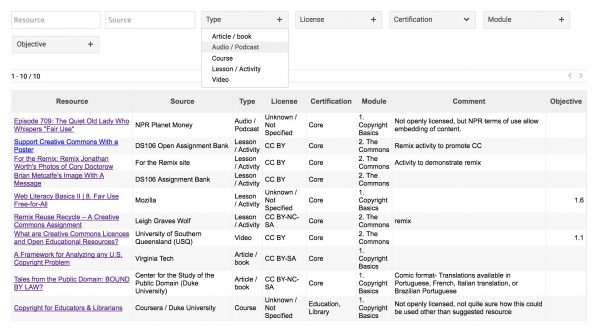
One plus is that the layout is more responsive than what I had before. But more importantly, the tools are more sophisticated to focus in on data by different filters and search. I can put copyright into the Resource field to show only items with “copyright” in the title:
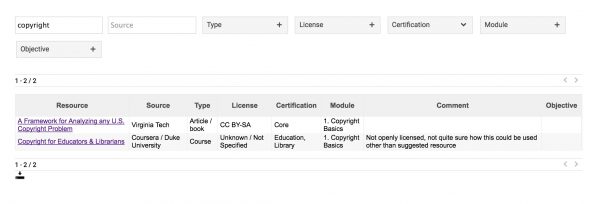
Now with only 10 rows of data, this may not be that impressive, but it would work the same if where there are hundreds of rows.
But wait, there’s more.
I can narrow in further with the drop down menu filters- these are from the form items that came from radio buttons and check boxes, so they can be used as limiters too- So if I narrow it in addition by items marked as specific to the Library Certification, I get one match.
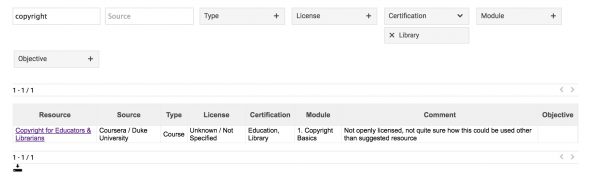
Again, this may not be the most exciting table for you since there are not many pieces of data, but when there is more, this should be useful when we are assigning them to different modules.
Now if I could only get you excited enough to add some more resources to the data.
Will you?
Awesome.
Oh one more “awesome” thing about Awesome Tables – it gives you some stats on the usage of the table

Awesome data on Awesome Table data.
Too much Awesome?
Featured image: flickr photo by Didriks https://flickr.com/photos/dinnerseries/7894656450 shared under a Creative Commons (BY) license

Well, it is never possible to have too much awesome among True Friends. Because you are always making a lot of sharing of awesome stuff, Still True Friend Alan. So it is always a good thing, and a Good Time to be reading when you make a blog post.
Well, bye!