I had completely forgotten that I’ve had the bits installed on this blog to capture data in Google Analytics, which for the paranoid means your browsing habits are feeding the big G machine (not the purpose of today’s meanderings).
In fact, I doubt I had looked at the reports at all, but they do contain an incredible amount of data, if that is your quantitative type of fun (I’d rather roll in the mud, myself).
Fortunately, they have a lot of visuals 😉 So for the past month, my readership seems to be going out of phase with the stock market:

So from June 21 to July 21, 2007, some 2790 people actually ventured here, or as my use of division suggests, about 104 per day. Wow, who are you? Analytics provides all kinds of breakdowns, by country (my readers are from 85 countries, mostly US, Canada, U.K. Australia, Germany, Ireland, Hong Kong hi Nick! and elsewhere), connection type, browser, etc.
And looking at the data from the sources of traffic
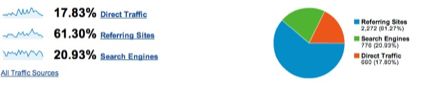
So most come from referring sources (linktribution rules, thanks), followed by search engine results, and direct links (mostly from RSS??). And you can see what these sources are:
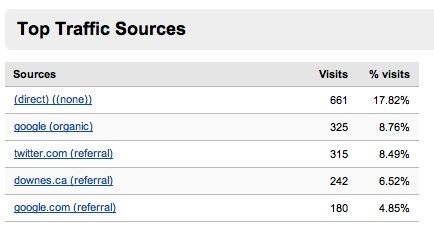
Now this is interesting- more than 300 visits came from referrals from twitter! And in the “Thanks for All The Links” department, I nod to Stephen Downes who, consistently since I started blogging in 2002, a mere mention in OLDaily generates many visits. Stephen, in the sea of edubloggers, you are an A Lister 😉
In fact, not to shower too much praise on Stephen, when I look at the blog posts that generated the most visits:
- Easy Peasy Rich Media – VoiceThreads 453 visits
- Expertise, Idiocy, Monkeys: Write Blog Postings and Articles 159 visits
- A Powerful Set of Images, Ideas 152 visits
- Worlds Shortest Articulated Blog Post (Relative to Length of Title) on the Absurd Opinions on Teaching With Technology, Courtesy of the Old Skool Luddite Club at the Chroncile 140 visits
I am fairly sure these were all ones mentioned in OLDaily.
And just by looking at these sites, I found something really cool- if you are logged in to Google Analytics, it provides a graphics overly showing data for every link on that page of your site:
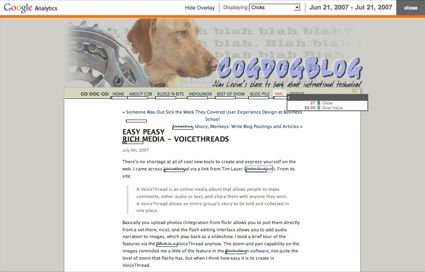
so the little bars show a measure of many links were followed, and data appears when you roll over the link.
Data overload!
I actually looked here for a rather simple task related to my last post about a friend who reads my blog. Google analytics told me that in the last 30 days, I had 2790 people visit this blog. I was curious about the comment rate. For this, I had to dive into mySQL, and write a query:
SELECT count(*) FROM `wp_comments` WHERE `comment_approved` = '1'
          and `comment_date` > '2007-06-20'
which gave me 104. So the percentage of people who comment of those who vist here is a whopping 3.7%.
Commenting is still the most under-rated activity done in the blogosphere.

I can spend a lot of time in analytics just pouring over all of the good stuff.
I agree – commenting is very underrated. We all read quite a bit but we don’t comment on those posts. I try to share through google reader and twitter when tI have something I really enjoy just so it gets pushed out there more.
whatever you do, don’t install this.
http://dashalytics.rovingrob.com/
you’ll wear out your F12 key…
Twitter is sending just over 1% of traffic to my blog (the #5 referrer). I haven’t written anything linkworthy for a long, long time, so most folks are coming to mine via google searches.
I bet you’ve gotten a LOT more comments than that – you’re just being picky about which ones you keep 😉 counting spam, you’re probably getting over 100% of visitors leaving comments!
You didn’t get the memo? Commenting is evil and pointless.
http://www.joelonsoftware.com/items/2007/07/20.html