URL reading and deciphering skills, plus some brute force Javascript, had me two hours making an animation. These things get in my head and won’t let me rest until I spend a chunk of time in the rabbit holes.
I entered this activity for yesterday’s Ontario Extend, a spawn of the DS106 Daily Create that I am now populating for the summer.
Daily Extend: #oext188 Where in the world have you been? How Much Have You Seen? Or where do you want to go? https://t.co/dQk27E4y6L pic.twitter.com/xenLboGLK4
— OntarioExtend (@ontarioextend) May 30, 2018
I had used this one before (I recycle) I believe as a UDG Agora Daily Try. If you do not know it by now, nearly everything I do or make is a remix.
I like it because on one hand it’s a small tool teachers may get some ideas how to build activities around. The Visited Countries Map Generator provides an interface where you can check off the names of countries around the world, and it dynamically creates the map for you.
It could be as we did, to show countries you have visited (or wish to), but just as well could be used to show a map of countries with certain economic indicators or a map of locations in a story or …
The thing I noticed right away is that the map image is generated dynamically. While you see an image, the code you cn use in a web site is not an image file:
<img src="http://chart.apis.google.com/chart?cht=map:fixed=-70,-180,80,180&chs=640x427&chf=bg,s,336699&chco=d0d0d0,cc0000&chd=s:99999999999999999&chld=BS|BZ|CA|MX|PR|US|VI|CN|JP|QA|SG|AU|NZ|DE|IS|ES|GB">
Alan visited 17 countries (7.55%)
<a href="http://douweosinga.com/projects/visited?region=world">Create your own visited map of The World</a>While most people might fog over in a faint at the site of HTML, to me it’s like good coffee. So in the img tag, src="" contains a URL we are calling some kind of Google API for charts that dynmically returns an image. Without bothering too much, I can guess easily for the value chld=BS|BZ|CA|MX|PR|US|VI|CN|JP|QA|SG|AU|NZ|DE|IS|ES|GB we are sending the list oc countries to map.
You can play with it in a web browser, by adding or removing countries. Try manipulating this URL
See what happens when you make it maybe my top five favorite ones
or making it even more colored
If you learn to ready and mess around with URLs like this, you can level up big time in the Game of the Web. I bet like 2% of web users even read URLs.
In his response yesterday, Steven Secord showed us URL understanding by taking the code for my map, putting it in the map tool, then adding his countries, to create a combined map
#oext188 @ontarioextend Here is a combination of my map and @cogdog's map: The #ExtendWest map. If anybody else wants to contribute, just paste the following code into the bottom of the Visited Countries app, add any countries you have been to and repost. https://t.co/GQ3eFSVIIL pic.twitter.com/dhAjngVmmG
— Steven Secord (@stevensecord) May 30, 2018
Lynn Cartan picked it up to
https://twitter.com/LynnCartan/status/1001826581478821888
Others did the Extend in their own way, that is the point, but as screenshots in twitter, all of the generating data is lost (and twitter turns those data URLs into other images, so its mostly for naught).
That triggered an idea to me that it would be nifty to make this an animation
I love the idea of a collaborative map, let’s see if we can fill it in. Then maybe turn into a GIF
— Alan Levine (@cogdog) May 30, 2018
Still the idea I had in my mind was that because the maps are generated by URL parameters, there might eb a way to create a web page that adds them one at a time.
I did some reading on Google’s Visualization Geochart which describes how to use the Google Maps API. They provide not only sample code, but ways to view and experiment with them via JSFiddle.
I played a bit with the color coded one of Africa, making some changes got e down the road a bit:
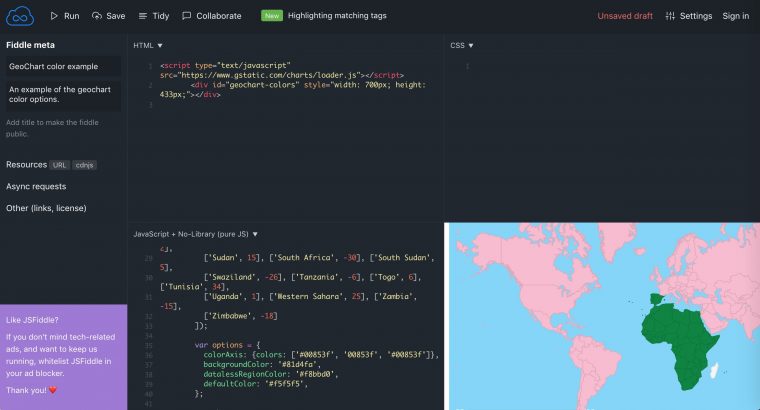
Removed the region to make a full map, changed the colors to represent all the same
It was enough to get me started making a map with the countries the Extenders had come up with. I used the ones in Lynn’s tweets, since it combined Steven’ss mine, and hers, which was like 12. I looked at other maps that were images and tried picking out about 28 more. This HTML got me a plain map:
Countries Visited By Ontario Extenders
Then I found by changing the values in the array for countries to 0, I could “turn them off”, like this modification which would show just Canada and Mexico
var data = google.visualization.arrayToDataTable([

['Country',   'Been'],

['KK', 0], ['MX', 1], ['CA', 1], ['BZ', 0], ['BS', 0], ['US', 0], ['PR', 0], ['JP', 0], ['SG', 0], ['CN', 0], ['AU', 0], ['NZ', 0], ['DE', 0], ['IS', 0], ['GB', 0], ['IN', 0], ['ZA', 0], ['CH', 0], ['NL', 0], ['MC', 0], ['IT', 0], ['FR', 0], ['VA', 0], ['JM', 0], ['MQ', 0], ['BM', 0], ['BB', 0], ['BE', 0], ['BR', 0],

]);
I then played around with ways I could send the array of countries as a variable… and it just kept bombing on my. Each time I did not explicitly declare the arrays in the google.visualization.arrayToDataTable() function it ended up not defined.
So I gave up and did it brute force.
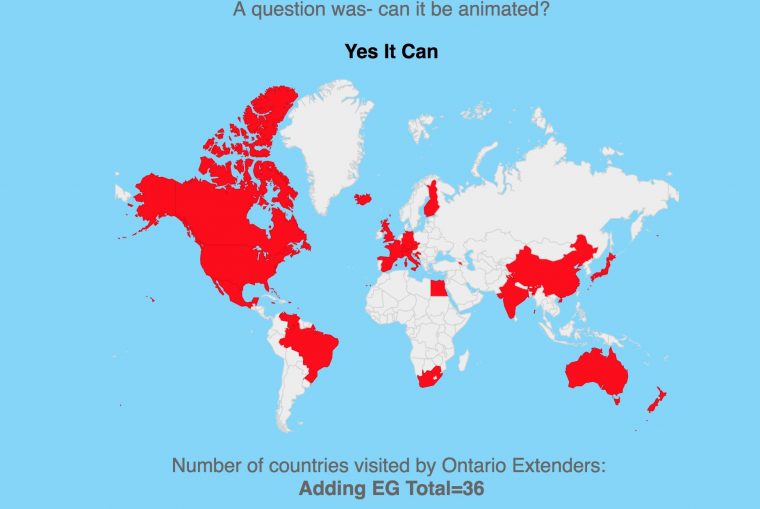
The first map loads with all the countries turned “off”. I created a global variable to keep track as a counter and deployed the JavaScript SetInterval function to set up something that would run every 1 second. This ended up a giant switch() statement that checked the value of the counter and then repeated the generating code for a new set of data.
It’s ugly, witness the ugliness at https://gist.github.com/cogdog/3e8a0e23684f17c3d1c6a55874016c07.
It took some brute force JavaScript, but here is an animation of the countries people mapped visited in yesterday's Daily Extendhttps://t.co/SAqWe7rtfP
(missed some that were done as screenshots, had to guess)
— Alan Levine (@cogdog) May 31, 2018
Here is one screenshot:
Sure it can be done much better. But enough is enough.
And in the process, I picked up a few small Google Map API chops
That’s a win for me.
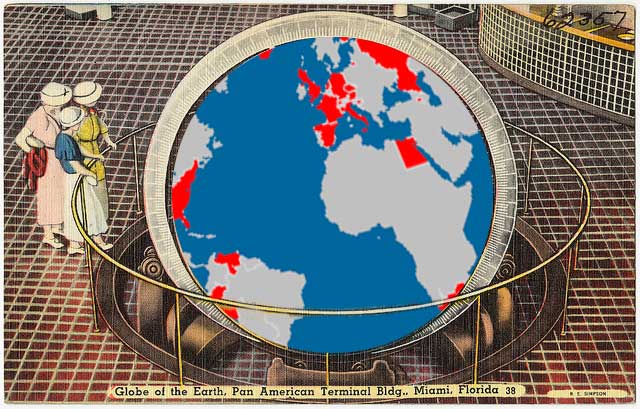
Featured Image: Modified from Globe of the earth, Pan American terminal building, Miami, Florida flickr photo by Boston Public Library shared under a Creative Commons (BY) license by superimposing a screenshot of the countries visited by Ontario Extenders

In following your blog Alan, I have learned to the love the URL. There is so much hidden in the code and not all of it is that complicated. A simple one that I got from you is
?randomto pick a random post.