As the second part of a series of posts about a leadership model web site created for project managed at JIBC, this one is about some of the early interface explorations I dabbled with.
In the first post, I laid ground for the map metaphor for leadership, there would be three “regions” corresponding to the model’s areas of Personal, Relational, and Organizational Leadership. Within these regions, the site’s resources could be accessed via a map of recommended trails and off trail destinations to explore.
I looked first at d3.js which I used previously for the dynamic plotted representations for the Constellection prototype, which too was based on mapping resources from a WordPress site. But while I found in the project gallery many examples of putting data into basemaps (e.g. a bubble map) I did not see anything like a trail map or something with destinations and routes plotted dynamically.
I forget how I landed on looking at Leaflet.js, a powerful library for generating dynamic maps:
Leaflet is the leading open-source JavaScript library for mobile-friendly interactive maps. Weighing just about 38 KB of JS, it has all the mapping features most developers ever need.
Leaflet is designed with simplicity, performance and usability in mind. It works efficiently across all major desktop and mobile platforms, can be extended with lots of plugins, has a beautiful, easy to use and well-documented API and a simple, readable source code that is a joy to contribute to.
This is a relief to find an open source platform, especially considering how many projects I’ve had using Google Maps getting torqued by their putting a price on using their API.
The lights clicked on when I read the “Not of this Earth” Leaflet tutorial.
Sometimes, maps do not represent things on the surface of the earth and, as such, do not have a concept of geographical latitude and geographical longitude. Most times this refers to big scanned images, such as game maps.
While I was not doing things off earth, this demo showed me how map elements of locations and routes could be plotted on to any base map, like the fictitious land maps I had already been dabbling with.
I spent 2-3 weeks working on some prototype maps where I would add pins for the recommended resources as well as some dots and lines for the others. The content was mostly place holder, but I got it working with different colored pins for the 3 areas, pop up descriptors with links, and even getting into creating map layers that could be toggled on and off.
This was all meant to show conceptually what an interface could look with, and thinking the rather than the hard coded locations and data I put in manually, they could be dynamically generated from a WordPress site.
To make the code work more available, I put the three prototypes in a GitHub repo, and published them as things to explore via GitHub pages.
So here is the site where all are available:
These are far from what I envisioned, but enough to show the potential functionality.
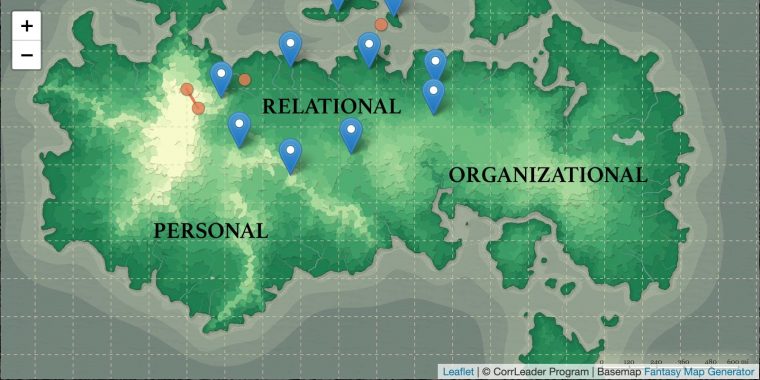
First Demo: Stuff On the Map
This first demo was really to get the hang of putting a few pins on the map. Here’s a bit of GIF action to amaze you.

All the Leaflet stuff happens inside the <script>...</script> tags at the bottom (see full source code for demo 1), but to outline it we first declare the map, set some boundaries to define the coordinate system, the image for the basemal, and a bit that adds the bottom left legend.
	var map = L.map('map', {
		crs: L.CRS.Simple,
		minZoom: -1
	});

	var bounds = [[0,0], [1000,1000]];
	var image = L.imageOverlay('images/land.png', bounds).addTo(map);

	map.fitBounds(bounds);

	L.tileLayer('', {
		attribution: '© CorrLeader Program | Map via MapGen4 '
	}).addTo(map);
Something that is useful (at the bottom) is some code that for development gives a way to get the local coordinates for a clicked location.
	// popup to give coordinates
	var popup = L.popup();
	function onMapClick(e) {
		popup
			.setLatLng(e.latlng)
			.setContent("You clicked the map at " + e.latlng.toString())
			.openOn(map);
	}

	map.on('click', onMapClick);
Back to the top, after setting up the map, I add this bit to define the red dot destination icons used for the “off trail” locations; the others I just use the built in pins.
	var destIcon = L.icon({
		iconUrl: 'images/dest-icon.png',
		iconSize: [18,18],
		iconAnchor: [9, 9],
		popupAnchor: [-3, -7],
		shadowUrl: 'images/dest-shadow.png',
		shadowSize: [18, 18],
		shadowAnchor: [9, 9]
	});
Then I define variables to represent my four map pin locations I will put into this demo (the coordinates come from the pop up code above).
	var teamwork      = [182.1, 207.0];
	var honesty    = [171.0, 426.0];
	var collaboration = [ 249.0,  625.1];
	var communication    = [127.2,  809.0];
Each one of these is defined by a chunk of code like below. I define a marker using the coordinates above, then add bits to create the popup message contents and a tooltip. Here are two of them.
	marker = L.marker(teamwork).addTo(map);

	marker.bindPopup('Teamwork Duo Reges: constructio interrete. Quod cum dixissent, ille contra. Quacumque enim ingredimur, in aliqua historia vestigium ponimus.');
	marker.bindTooltip("Teamwork");

	marker = L.marker(honesty).addTo(map);
	marker.bindPopup('Honesty Lorem ipsum dolor sit amet, consectetur adipiscing elit. Compensabatur, inquit, cum summis doloribus laetitia. Mihi, inquam, qui te id ipsum rogavi? Que Manilium, ab iisque M. A mene tu? ');
	marker.bindTooltip("Honesty");
These are just brute force added to the map, later I can see turning this process into a more elegant function. Maybe.
For the off trail locations, I define their coordinates, add the popups, then use the polyline function to connect them (if needed).
	var teamwork1 = [234.0, 232.5];
	var teamwork2 = [195.0, 280.5];
	marker = L.marker(teamwork1, {icon: destIcon}).addTo(map);
	marker.bindPopup('How to turn a group of strangers into a team TEDtalk by Amy Edmonson, Oct 2017 Watch Now');
	marker.bindTooltip("Amy Edmonson TEDTalk");


	marker = L.marker(teamwork2, {icon: destIcon}).addTo(map);
	marker.bindPopup('ENAV 2450 - Leadership and Teamwork BCIT School of Transportation Course More info');
	marker.bindTooltip("Leadership and Teamwork course");
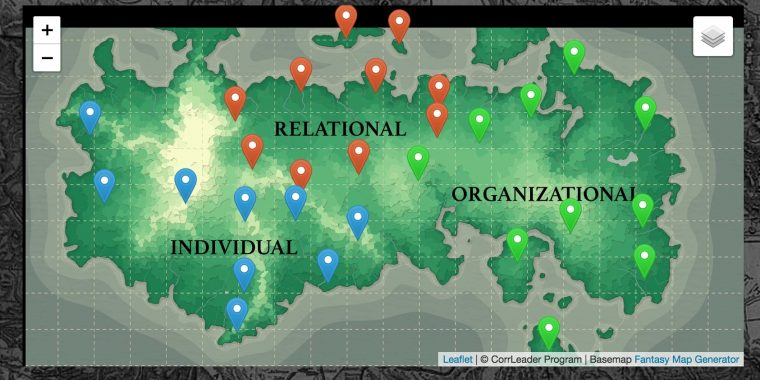
Second Demo: A New Map Base
The second demo is not any different for the map code, it has a few more pins added, but mainly this was to make use of what I felt was a more map-like base map. The source code of this map too is available for forking and peeking pleasure.
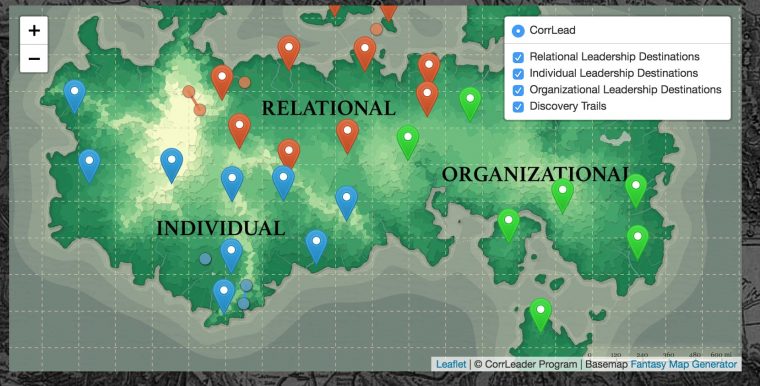
Third Demo: Pins in Every Region, Toggled Layers
The third demo added some more functionality. There are different colored pins added to each region, but the bigger deal was adding the legend (top right) with the regions defined as layers, as well as the “off trail” locations, that can be toggled on and off.
Again a Leaflet.js tutorial on layers and groups got me moving in the right direction.

The top tight icon has the layers which can be toggled on and off. The off trail resources (Discovery Trails_ are not shown on initial load, but can be toggled on here.
I’ve tossed almost enough code here, but this one too is fully available to look at.
The set up is the same as the first demo, this time we define a few more location images. But given the number of items here, I got them set up to be populated in a loop.
For the Relational markers (red) , I first define the layer group and set up an object/array for all the data:
	/* Relational Pins */
	let relationalg = L.layerGroup();

	let rnodes = [
		{"label":"Teamwork",
		 "loc":[295.0, 232.2],
		 "pop": 'Teamwork is the ability to work cooperatively with others to achieve group objectives. This competency is fundamental because leadership is not an individual sport. The essence of leadership is accomplishing worthy goals through the combined efforts of others, and teamwork capabilities are crucial. In this section you\'ll learn teamwork strategies, such as the four phases of team development: forming, storming, and performing.',
		  "link": "#"
		 },
		{"label":"Honesty",
		 "loc":[327.0, 305.2],
		 "pop": 'Honesty  is a leader\'s most valuable and most valued leadership quality; it serves as the gateway for trust and inspiration.',
		 "link": "#"
		 },
		{"label":"Collaboration",
		 "loc":[326.0, 388.2],
		 "pop": 'Collaboration  A collaborative leader invests time to build relationships, handles conflicts in a constructive manner, and shares control.',
		 "link": "#"
		 },
		{"label":"Communication",
		 "loc":[308.0, 458.2],
		 "pop": 'Leadership communication consists of those messages from a leader that are rooted in the values and culture of an organization and are of significant importance to key stakeholders, e.g., employees, customers, strategic partners, shareholders, and the media.',
		 "link": "#"
		 },
		{"label":"Coaching Skills",
		 "loc":[380.4, 414.4],
		 "pop": 'Coaching Skills includes the dialogue in which the coach facilitates the coachee, to learn, clarify values, release potential and increase performance by focusing on goals to achieve success.',
		 "link": "#"
		 },
		{"label":"Influential Leadership",
		 "loc":[386.0, 355.0],
		 "pop": 'Influential leaders are defined as leaders that rely on influence as opposed to coercion. These leaders create followers who want to follow as opposed to followers who believe they have to follow.',
		 "link": "#"
		 },
		{"label":"Delegating",
		 "loc":[242.5, 250.5],
		 "pop": 'The delegating leadership style is a style of leadership where a group leader assigns projects or assignments to their employees and gives them free reign to work. The employee(s) get to make all decisions and choices, which they are then responsible for.',
		 "link": "#"
		 },
		{"label":"Investing in People",
		 "loc":[214.3, 304.8],
		 "pop": 'Successful leaders understand the difference between things and people in an organization. They know that it\'s important to manage things, but that it\'s even more important to invest in people. Leaders don\'t just mouth empty phrases like “people are our greatest resource;” they demonstrate by their actions that people – not strategy, products, plans, processes, or systems – are the most critical factor in an organization\'s performance.',
		 "link": "#"
		 },
		{"label":"Effective Communication at Work",
		 "loc":[236.4, 369.2],
		 "pop": 'According to many researchers, a leader is one who has an ability to take charge, direct, encourage, or stimulate others... Good communication skills help to develop better understanding and beliefs among people inspire them to follow the principles and values which their leader wants to inculcate in them.',
		 "link": "#"
		 },
		{"label":"Leading Through Collaborative Communication",
		 "loc":[276.9, 455.7],
		 "pop": 'Leaders demonstrate their trust in employees by the open, candid, and ongoing communication that is the foundation of informed collaboration.',
		 "link": "#"
		 }
	];
This means I can add them to my map like:
	for (let i = 0; i < rnodes.length; i++) {
		marker = L.marker( rnodes[i].loc, {icon: redMarker}).addTo(relationalg);
		marker.bindPopup( rnodes[i].pop + '(more...)' );
		marker.bindTooltip( rnodes[i].label );
	}
It’s nobody’s compact code, but it’s a little less brute force. The other two regions are defined this way.
The map set up for this one is done at the end, along with the new code to set up the layers/groups.
	var mbAttr = '© CorrLeader Program | Basemap Fantasy Map Generator';

	var landmap   = L.tileLayer('', {id: 'mapbox.land', attribution: mbAttr});

	var map = L.map('map', {
		crs: L.CRS.Simple,
		minZoom: -1,
		layers: [landmap, personalg, relationalg, organizationalg]
	});

	var bounds = [[0,0], [400,800]];
	var image = L.imageOverlay('images/land2.jpg', bounds).addTo(map);

	map.fitBounds(bounds);

	var baseLayers = {
		"CorrLead": landmap
	};

	var overlays = {
		"Personal Leadership Destinations" : personalg,
		"Relational Leadership Destinations" : relationalg,
		"Organizational Leadership Destinations" : organizationalg,
		"Discovery Trails": trailg,

	};


	L.control.layers(baseLayers, overlays,{collapsed:true}).addTo(map);
So What Next?
This was really to give my clients an idea about what was possible in a dynamic map interface. This was not even tied into a WordPress site, as that was a process that needed to go through some hoops wit the Technical Services team that manages their servers.
This, in fact, changed everything, but that’s the next post.
Still. if this never got into the site, I learned a ton about using Leaflet.js and you never know when that might come in handy on some other project. There’s rarely anything lost in prototyping, if you are learning as you go.
See all the posts in this series…
Featured Image: Screenshot from the third demo prototype.