I have no insight to the future of twitter as a company that rumbles around the conjecture, business, and tech gazing blogs. Tech is always a moving target. Below are some thoughts and even charts and graphs about our use of twitter for the UdGAgora project, focussing for now on the use with our two weeks of intense face to face sessions now behind us.
Twitter was and is not a specified/required component of the project. We sought to use it to as one means of achieving the openness characteristics that were in the project’s design (“Learners” meaning faculty “Participants”):
All resources for the program will be online, and open. It is expected that learners will contribute to the open resource environment.
….
Learners will be expected to collaborate, share, and contribute openly to a community of practice that fosters the enrichment of student centred learning experiences with the use of mobile learning
Our UdG colleagues informed us that twitter was not unknown to faculty, but also not likely as widely used as in North America. Personally, many there make use of WhatsApp and Facebook for networked communication. We suggest they find any means to communicate in the phase we move into where they are asked to give each other peer support starting as triads.
Avoiding the terminology of environments as closed rather as “bounded” the way Catherine Cronin describes them, what twitter leverages in my opinion is a more porous space, one that allows freer flow in and out from people not directly involved. It’s not better than others, but different.
The Survey
In the ramp up I suggested we do a simple survey to (a) collect twitter names (with the idea to form a list in twitter) and (b) get a grip on people’s experience level.

Our simple 2 item survey
It went to all participants the week before our first face to face sessions, but we never did a followup, so the number of responses (129) is low considering there were over 300 participants. It was one of the things that got lost in the rush of so many other things we were trying to do. So the data ain’t great.

UdG Twitter Survey results
But it does show the range of experience tilted towards the lesser end of the spectrum. And that maybe a 1-5 scale would have been better for this question. In adding the respondents to out list I could see the newness played out (egg icons, this is my first tweet tweet), as well as a number of people who created and tweeted a bit in 2009, 2010 and almost none since, and other very active folks, with thousands of tweets. Always a spectrum.
At least from a welcoming thing, using our project account @AgoraUdG, I aimed to respond to every first tweet and send welcomes to others. Little kills that early step into twitter more than feeling unheard.
And we encouraged in our early emails, and our sessions, that people tweet out reactions, ideas with the #UdGAgora tag. As described earlier, the Daily Try activities are set up for responses entered via twitter, and hopefully suggested how tags can be used to collect related content.
Twitter Names as an ID
My other idea came out of the work done in the last few Feed WordPress Aggregation hub things; asking for a twitter name solely to use as a unique username on the site.
So the modifications I did for the UDGAgora’s Challenge Bank (this is going to be a long future post) including an option to require a twitter name when people submit a response to a challenge (these are authored in the bank, rather than externally in blogs like ds106).
If people managed to enter their twitter name (or if they really objected to twitter, they could enter any unique string with an “@” in front), there would be a built in way to let them track their work from a unique URL, it acts like a tag.
This enabled me to create a Leaderboard for the Challenge Bank:

And for example, Jenny has a link that shows all of her contributions to the site that does not require her to make an account on the site.
This is a bit of my own attitudes on badges and tracking; there was a question about could we create a game like system of tracking points or adding badging to the mix. There was not really time to do something huge, and from my own philosophy on this, I wonder about how much service we give when we create systems that do all the tracking for us, as opposed to encouraging a practice where people track their own progress (and there we go again, that’s another post).
The leaderboard to me helps support people who want to track their own work, a source of information more than a solution.
So that’s my gimmick- asking people to create twitter accounts not primarily for the sake of tweeting, but more to have a unique name in our systems. And one that need not be tied to their real name.
Tweets As Linkable References
For the work participants do/did as responses to Challenge Activities we ask them to provide a link that shows their work. Quite a few apps in the iPad actually make getting a public link a huge, or maybe impossible task (I am looking at GIFBoom, and Vine).
But built into most apps is the feature to tweet something, so many times we suggested that participants tweet their work (a) to share via the #UdGAgora hash tag; but also (b) so they could get a link for a tweet that is a container for media or a link.
For example, Cruz created a GIFBoom animation that he then tweeted as an example to use as a link for his response.
Columns @cruzsaucedo1 http://t.co/rmBmgW11Rw
— Cruz Saucedo Navarro (@cruzsaucedo1) July 23, 2015
And we can see how rotten is the integration of GIFBoom, embedded tweets do not work on a laptop, but the link does, and on an iPad its even worse. The links want to open the app in the app store, and then you have to click a link, and… sigh.
But Vine videos did very well by linking via a tweet, as Xoch So shows.
Let me say again- what twitter provides is a data source- each tweet is referenced by a unique public URL, and the media in a tweet can be accessed via an embed or a link.
Twitter TAGS, Visualizaing Conversations, and the Inevitable Death Star
As always I created a Martin Hawksey Twitter Tags data collector for #UdGAgora. I have a few early screen grabs of the Conversation Explorer, if I was more diligent I might have a worthwhile time lapse series:
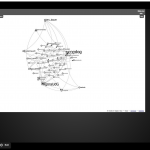
And now when you look, it is the traditional “Death Star” shape, which really shows that there is some core of more active accounts surrounded by less connected ones:
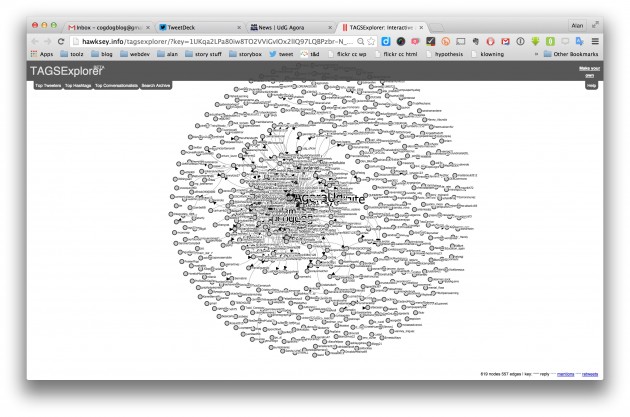
Twitter TAGS Conversation Explorer August 3
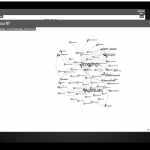
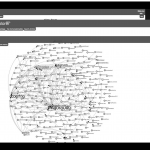
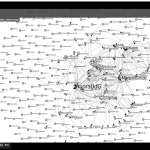
You get a bit of fun fluid effects when you zoom in and out, or grab nodes and drag them around:
But the spreadsheet provides more useful summary data; we have over 4000 tweets for the hashtag, and I count 404 unique accounts that tweeted out with the tag.
There was interest from the audience when they showed this, and I suggested it is something easily they could do for a course, class, project, if they invent a unique hashtag. I’d hope people night find themselves in the comsic ooze, an ponder what the activity suggests about their community activity, e.g.:

@NancyWhite a highly active faciliator
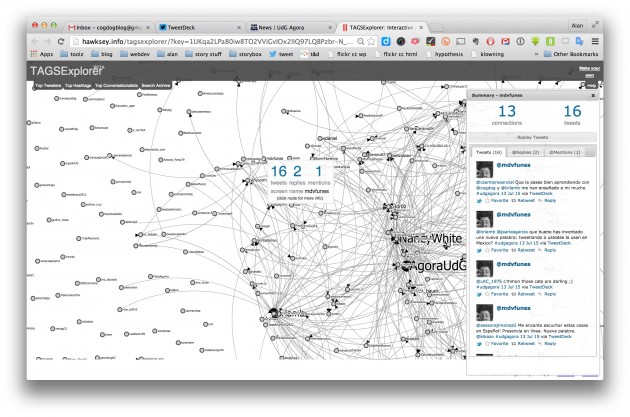
@mdvfunes tweets, and outside participant / observer

@vdaniel’s tweets, another participant

@Omata10mar Tweets, moderately connected participant
Twitter Activity Week 1 vs Week 2
My colleagues suggested from their observations that twitter has a bit less active during the second week of our sessions. We did make changes to the schedule and some of the activities, in week 1 there was more explicit direction to tweet responses to the Daily Try at the end of our lunch sessions. But that only explains part of it; the vibe of week 2 everyone agreed felt a bit more introspective than heading out (?).
There are hunches, and there is some data!
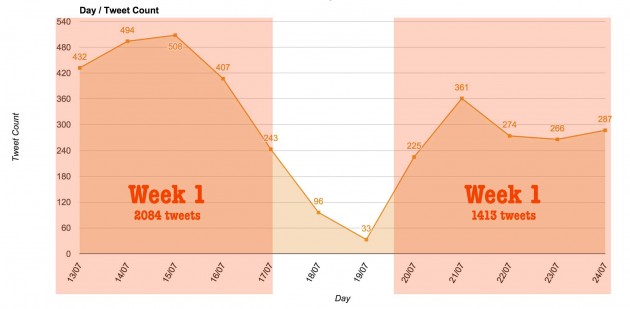
Comparison of Twitter Activity by Week of F2F Sessions (data from Twitter TAGS archive)
And hunches are shown to be accurate. By the way, I got this data by setting up my own sheet in the Twitter Tags data to do some filtered counts of the date cells (maybe it’s already in there Martin, I just wanted to see if I could do it)

Spread sheet for getting twitter counts by day
As an example, for July 16, I get a count of 407:
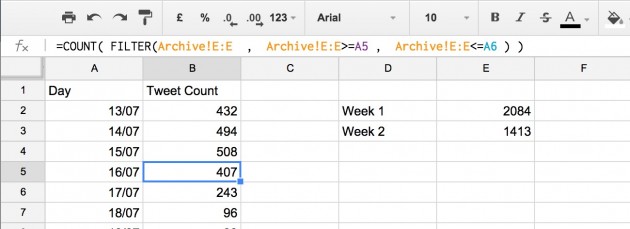
This is done by looking at the time stamp in Column E of the archive, and counting the cells where the date is greater than July 16 and less than July 17:
=COUNT( FILTER(Archive!E:E , Archive!E:E>=A5 , Archive!E:E<=A6 ) )
And filling that formula on down. Then I could turn it into a bar chart.
Seeing the Tweets
I'd forgotten this, but it might have been helpful to have a running visual display of twitter activity. Brian suggested Visible Tweets (which has been around a long time):

Nancy says it makes her dizzy and nauseous. We do not want that. She suggested Tagboard, which I really like as a public display for hashtags, and it not only does twitter, but also flickr, instagram, facebook, and a few more services... So I made a Tagboard for #UdGAgora

A nifty feature is as an admin, you can mark "featured" items, and holy curation, Batman!.
I will remember to use TagBoard for future projects as well.
So What with the Tweets?

flickr photo shared by cogdogblog under a Creative Commons ( BY ) license
We know not everyone took to twitter. Thats okay. It's one among a mix of platforms we tried to introduce. I'd like to think some people got some ideas or at least enough direct experience to speak about.
It will be interesting to see how the activity plays out in mid August when we start our 8 week online phase (which is to be centered around a discourse site).
There is a lot of slop in twitter, just keep that in mind. It's hardly perfect. What is? But we had a few people who were absolutely doing things right, their account was not protected, they were using hashtags, the tweets showed up as links on a search, but still were ignored in the hash tag URL.
But I'm pretty jazzed by the activity we did generate.
Tweeeeeeeeeeeeeeeeeeeeeeet!
Top / Featured Image credit : flickr photo by cogdogblog http://flickr.com/photos/cogdog/7175732809 shared under a Creative Commons (BY) license It's own photo, by the rules, I do not have to provide attribution, but here is why I do

Did the week one folks Tweet much during week 2? I also wonder about the handful that have continued tweeting…
Ancedotedely I can some did, but because we did not do good surveying, I cannot say for sure which twitter accounts were in which week. Someone more clever with spreadsheet formulas might be able to figure how many people who tweeted in week a did also in week 2.
Hi so interesting, blog reflexión, well I found in some groups, something like contest about leader board and tweets, in first week i found some challenges were tagged with the name of Ágora instead of real tweet name, i asked to the team that time i was working with, and they understood it was ok.
I’m working on my course sites again (because hey, classes start on Monday).
Getting my students to commit work via blog posts (on their own blogs) and feeding that into the mother ship via FeedWordPress worked well, they also commit code to GitHub (usually linked in blog post) which also has RSS and I’ve managed to get some to be active on Twitter with my #TC101 hashtag.
What I really want to do this semester is better visual layout to make the site more attractive. I know I need to spend some time curating feature posts/tweets/github commits. Or do I?
Not sure Ken. Syndication as you know gets messy, and its a lot of work to get stuff into a visual oriented theme that hinges on featured images. Why not pass the curation tasks on to your students?
That’s what I was thinking with the “or do I”? I’ll bring it up with my students in class when I see them in person Thursday/Friday.
A lot of times I have to edit posts to get best featured image. So if some manual intervention not a problem…
And maybe if students pick, they could add a editors note explaining why the choose it as featured. To get fancy, they could put note in a custom post field, and mod the theme to display it as a prefix to post.